Broad-Spectrum #21: Hikes & Cuts, Dungeons & Dragons.
Are we going up or down in the Debt Ceiling? How about the markets?
Welcome to Broad Spectrum Finance.
It seems, that we are past the “banking crises” narrative. Not a lot of has been going on since our last post apart from that. The debt ceiling issue still is not completely fixed.
Treasury is running out of cash for the U.S. government. They have like $45 bucks as of today. That’s like one cup of Grande Latte at Starbucks, isn’t it?
Will the history rhyme?
And here’s another one to refresh our memories:
Some banks are warning their clients about how much worse it can get this time, compared to 2011. Guess who. Yes. Starting with that one. The one which eats smaller banks for breakfast.
While this story has been the main narrative, injecting any kind of action in the markets, we kept wallowing around the 4,200 on SPX. Indeed, this can be considered as an optimistic sign for the future of the index for some, yet it still does not mean that we are in the clear for the bulls’ side.
A quick note: Bull traps are a common thing in SPX lately.
However, a big part of this performance is coming from the largest and heaviest stocks in the index. Very, very concentrated performance.
If we look at the SPX from an equally-weighted perspective, it sort of sings a different tune, and it is not as optimistic. It is more like a drifting-down kind of a thing.
However, traders just don’t seem to believe that we can go lower from here much.
Yes, we all saw the NVDA 0.00%↑ guide skyrocket. But apart from that and a few other AI thingies, we are seeing corporate profits drop across the board a little bit.
While this big jump of NVDA 0.00%↑ might be from AI, and AI might be just a fad that might grow into a bubble and slowly fade out; we might be in the earlier stages of it, as of today.
Sentiment readings have been quite pessimistic across the board, both in the U.S. and the world. However, portfolio allocations show, that investors are still deeply invested, and not sitting on cash.
The relationship between how the tech goes up, and how the volatility is suppressed down is interesting. Volatility has started to pick up a little bit, just like it did the next time back in Q4 2021, when the tech stocks were in overstretched levels.
It looks like a solid several year bottom might have been formed for the Global Banks.
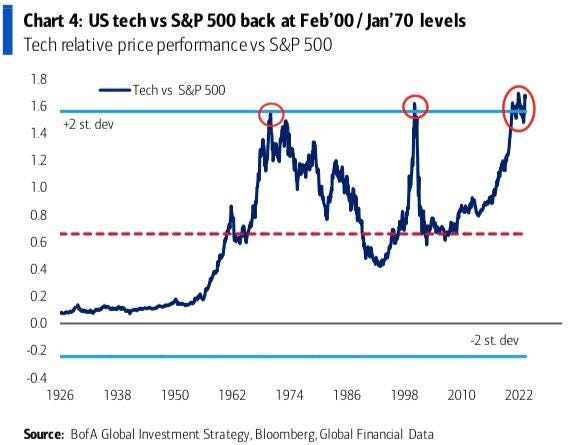
Now, we have been witnessing a sectoral rotation between the market indexes since the beginning of this year. Tech Stocks and Artificial Intelligence labeled names are leading the pack.
The price action favors the tech names.
The pictorial representation of the history of this relative performance suggests that we either might be closing in on a clean break, or a regression to the mean, and there might be a few scenarios for the latter. The former is... well, quite a bit unprecedented and uncharted territory.

Coming into June, we’re expecting more exciting and all-encompassing narrative to take hold of markets.
We’ll be back with more content soon.
Up until then, stay tuned.
Sources
The Market Ear, Callie Cox, Topdown charts, Refinitiv Datastream, Yuriy Matso, The Daily Shot, StockCharts, TradingView, U.S. Department of Commerce, Wells Fargo Economics, Bank of America Global Investment Strategy, Bloomberg, The Chart Report, Topdown Charts newsletter, Refinitiv Datastream, ICI, AAII, II, Koyfin, Bank of America Global Investment Strategy, Bloomberg, Global Financial Data


